Hello,
In ONLYOFFICE Desktop Spreadsheet 8.3.3.21, I would like to set fixed minimum and maximum value of the axis of a XY chart. Unfortunately in certain condition my maximum value is not accepted.
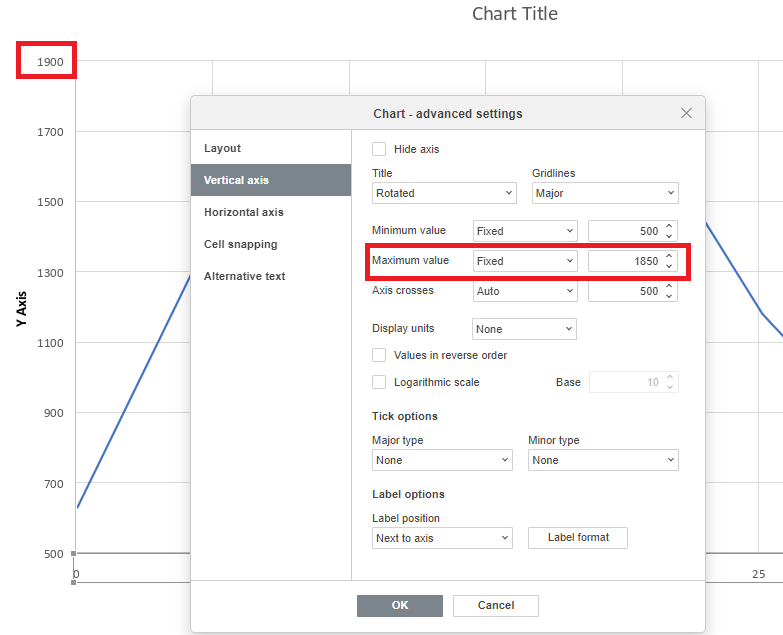
The picture below illustrates the problem (I set a maximum value of 1850 but ONLYOFFICE always displays 1900):
I think it’s related to the way that ONLYOFFICE manage major gridline with any flexibility (always 7 intervals of a predefined value).
Giving the user, the choice of interval value would be a nice solution and would also solve the request of this post: Vertical axis interval number in a line chart (spreadsheet)
This feature is properly managed by Excel.
Best regards