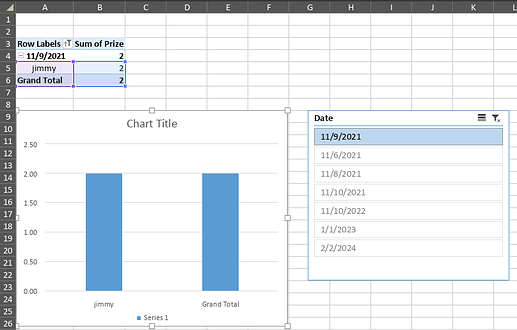
I have a pivot chart and a slicer that filters. How can I add a chart that automatically updates it. For example I have a slicer that filters date and the chart should show the winners from the pivot table. But I need to manually select the data. So if there is more names for other date the chart won’t pick them.
Hello @stanislav
Probably I misunderstood your request. I created a table, slicer and chart and it works as expected:Monosnap
Could you please provide us with details of desired scenario?
I’m sorry. I’m new to onlyoffice, was mainly using excel and just a little bit confused. How did you connect it like that? When I insert a chart it doesn’t change the data automatically with slicer.
Please clarify your request. I have checked provided video and it looks that slicer and chart work.
