Hello,
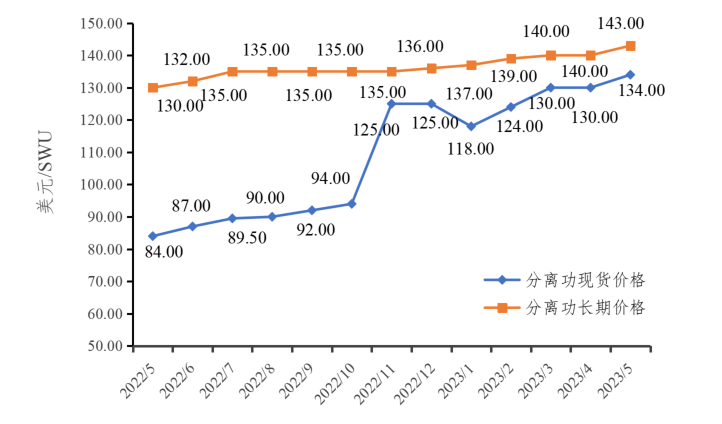
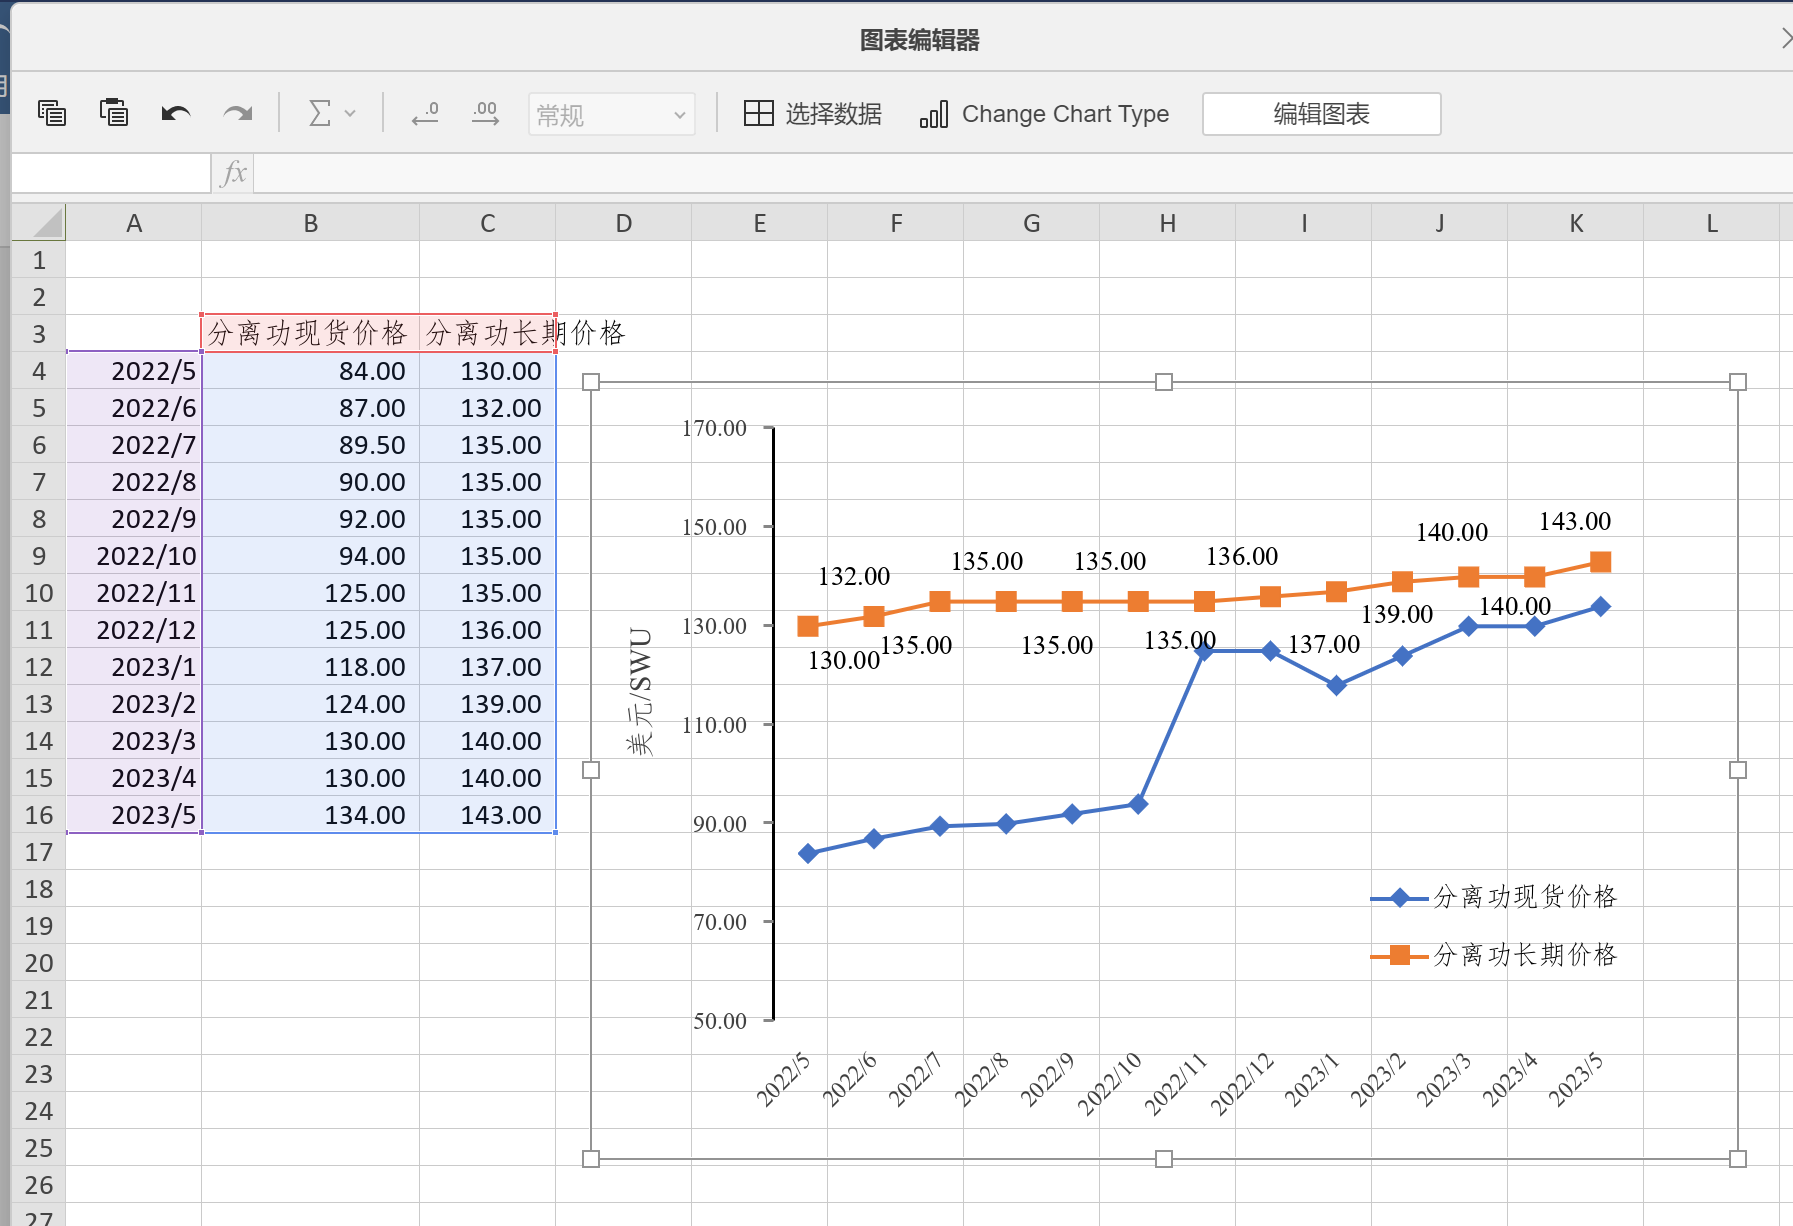
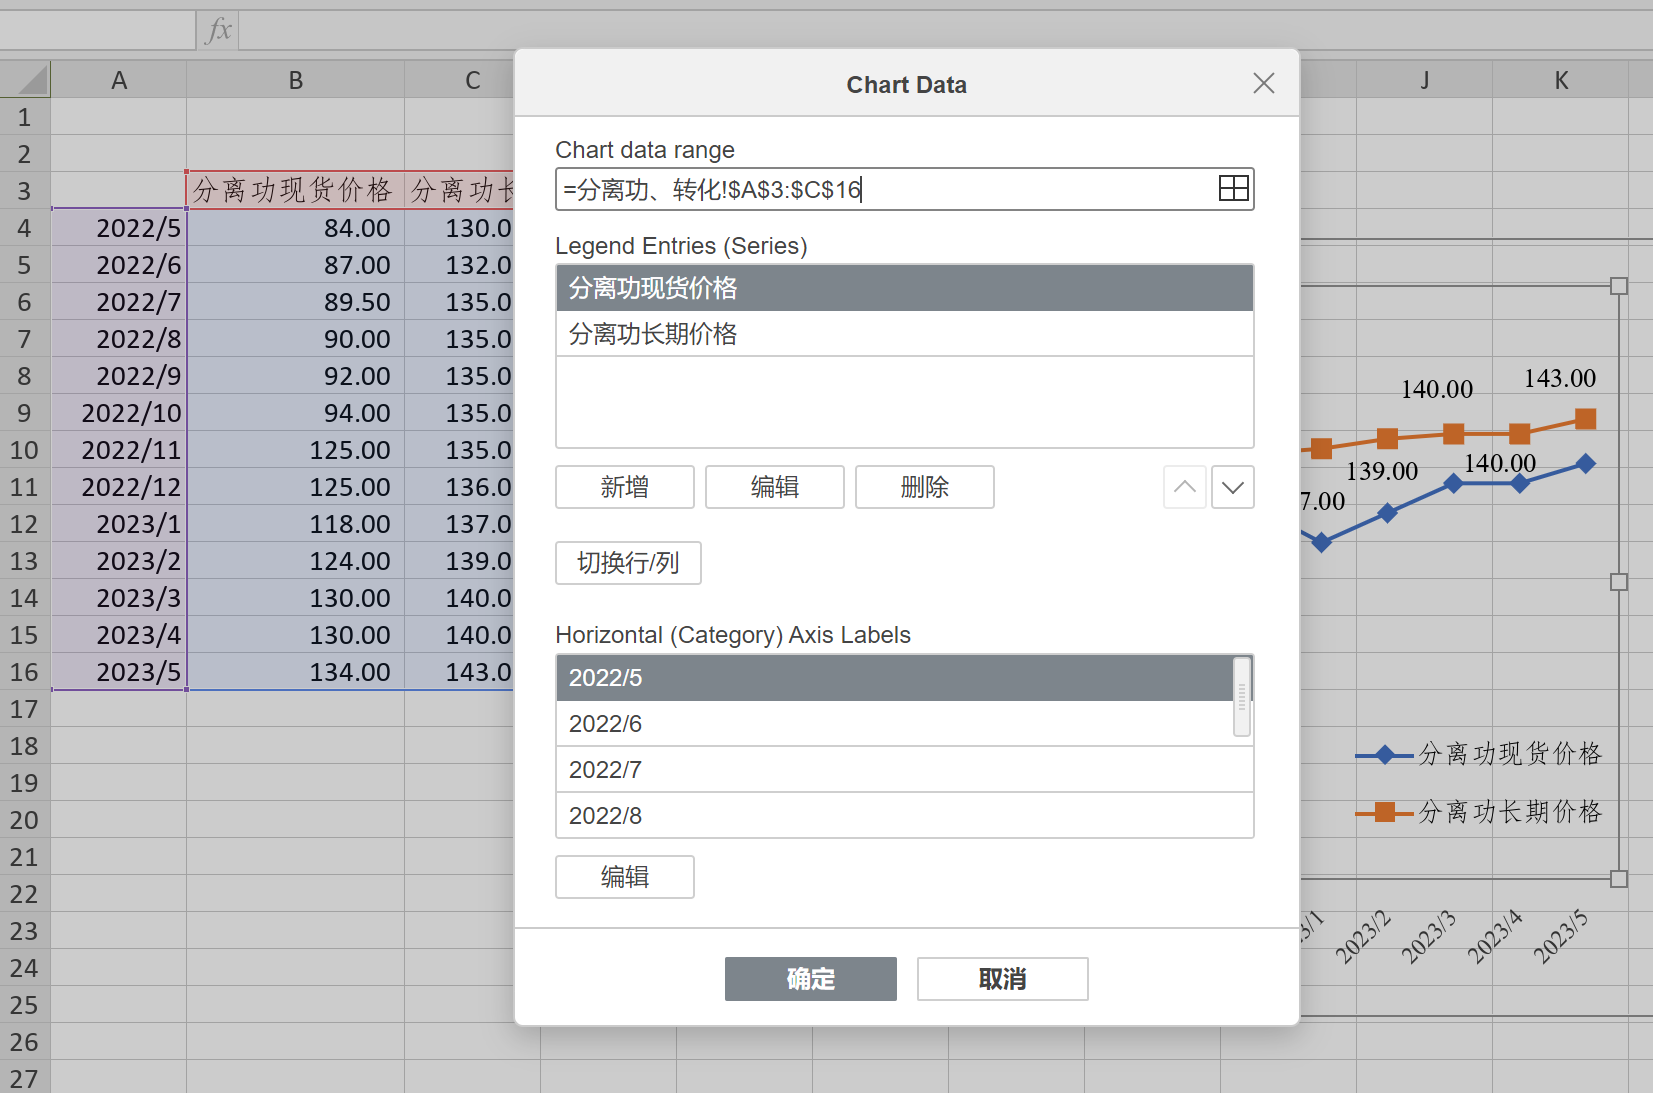
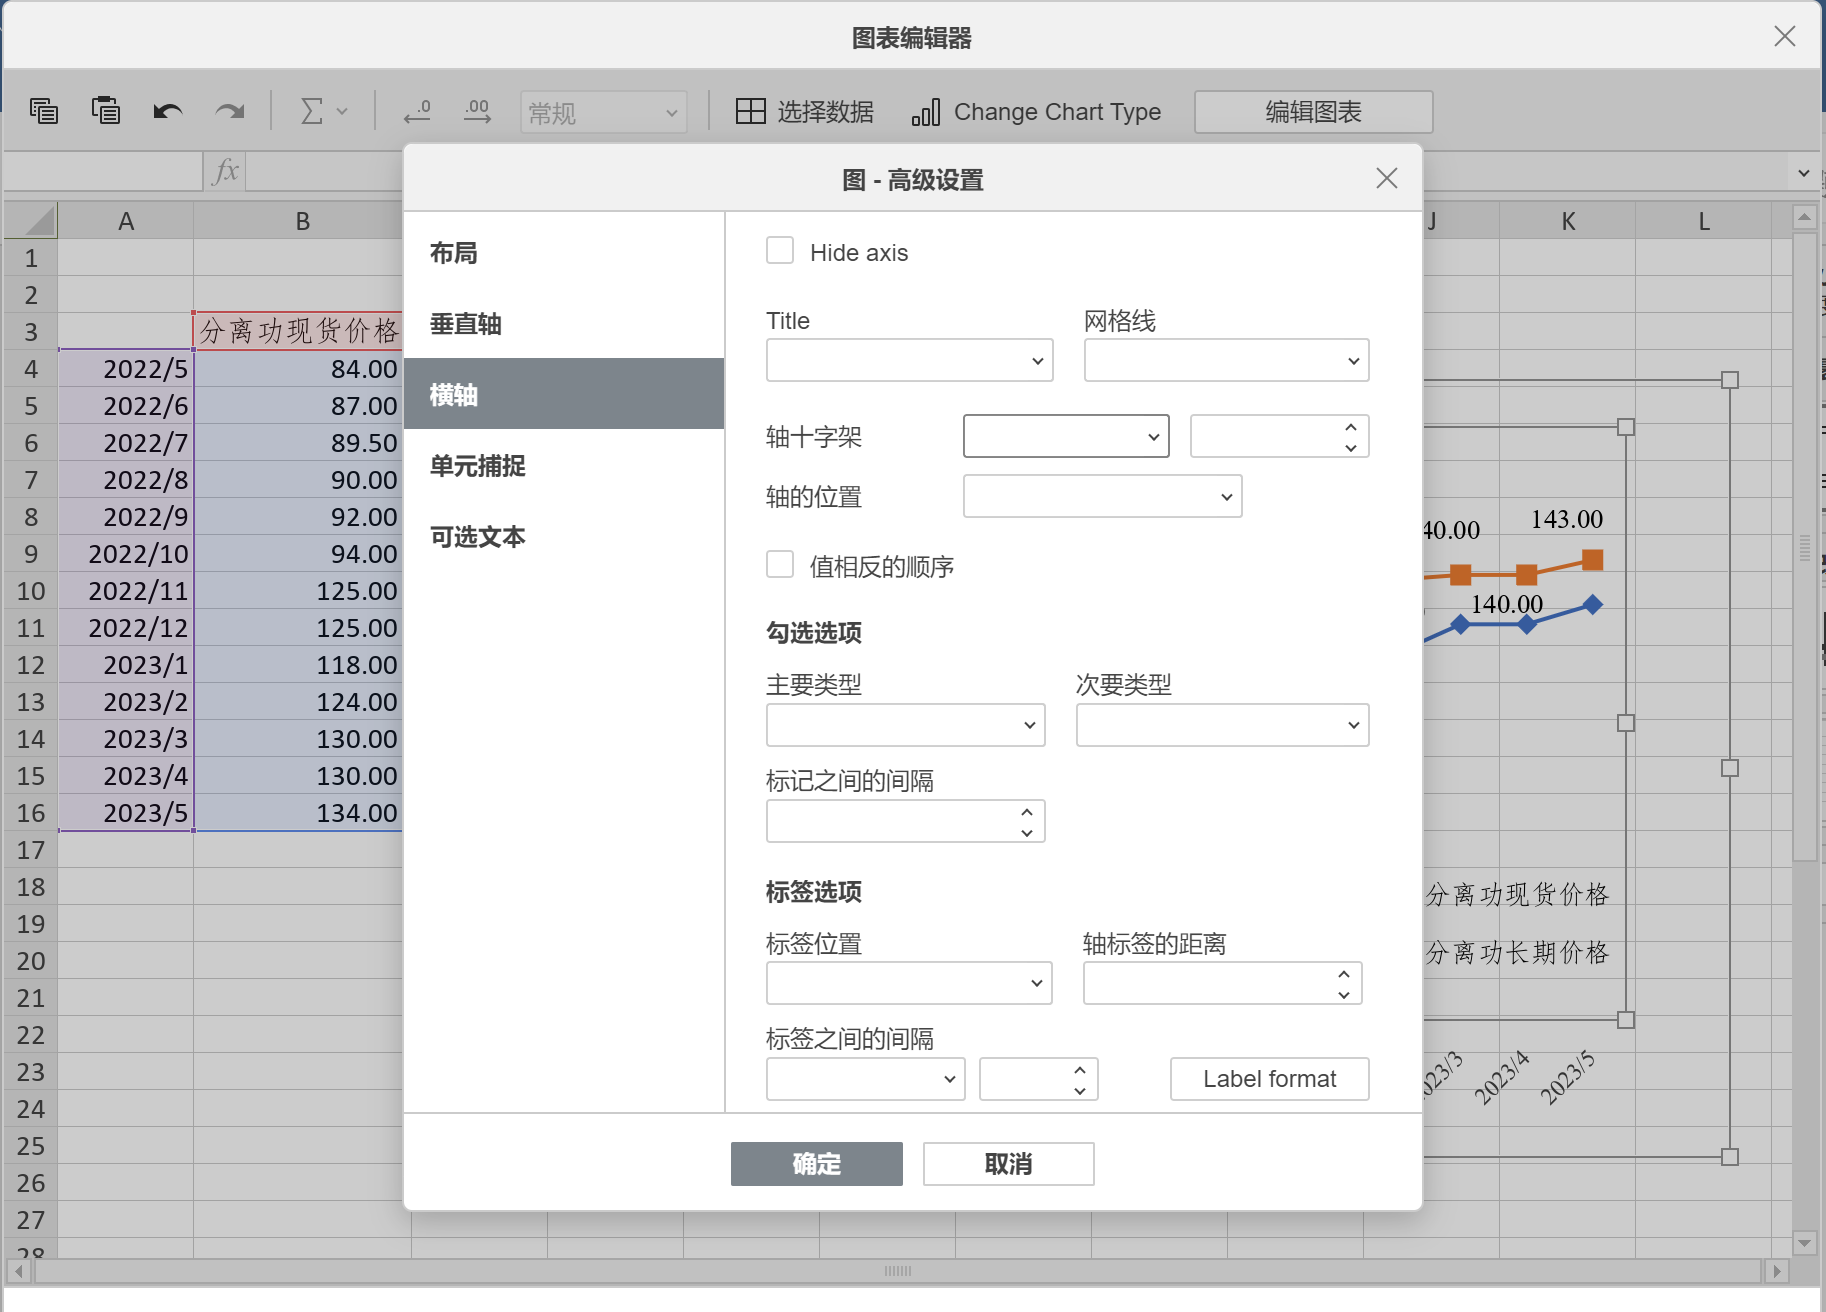
After uploading data like this,the horizontal data of the chart is displayed correctly.But the horizontal axis setting in the chart’s Advanced Settings is empty.I want to show the horizontal axis of the chart but I can’t find it. How do I set it?
Thansks in advance for your help
(P.S Since I am using the Chinese version, please understand if it is inconvenient)
!
Document Server version:7.2
Type of installation of the Document Server (docker, deb/rpm, exe):docker
OS:windows 11
Browser version: chrome